All work
Case study · 2026
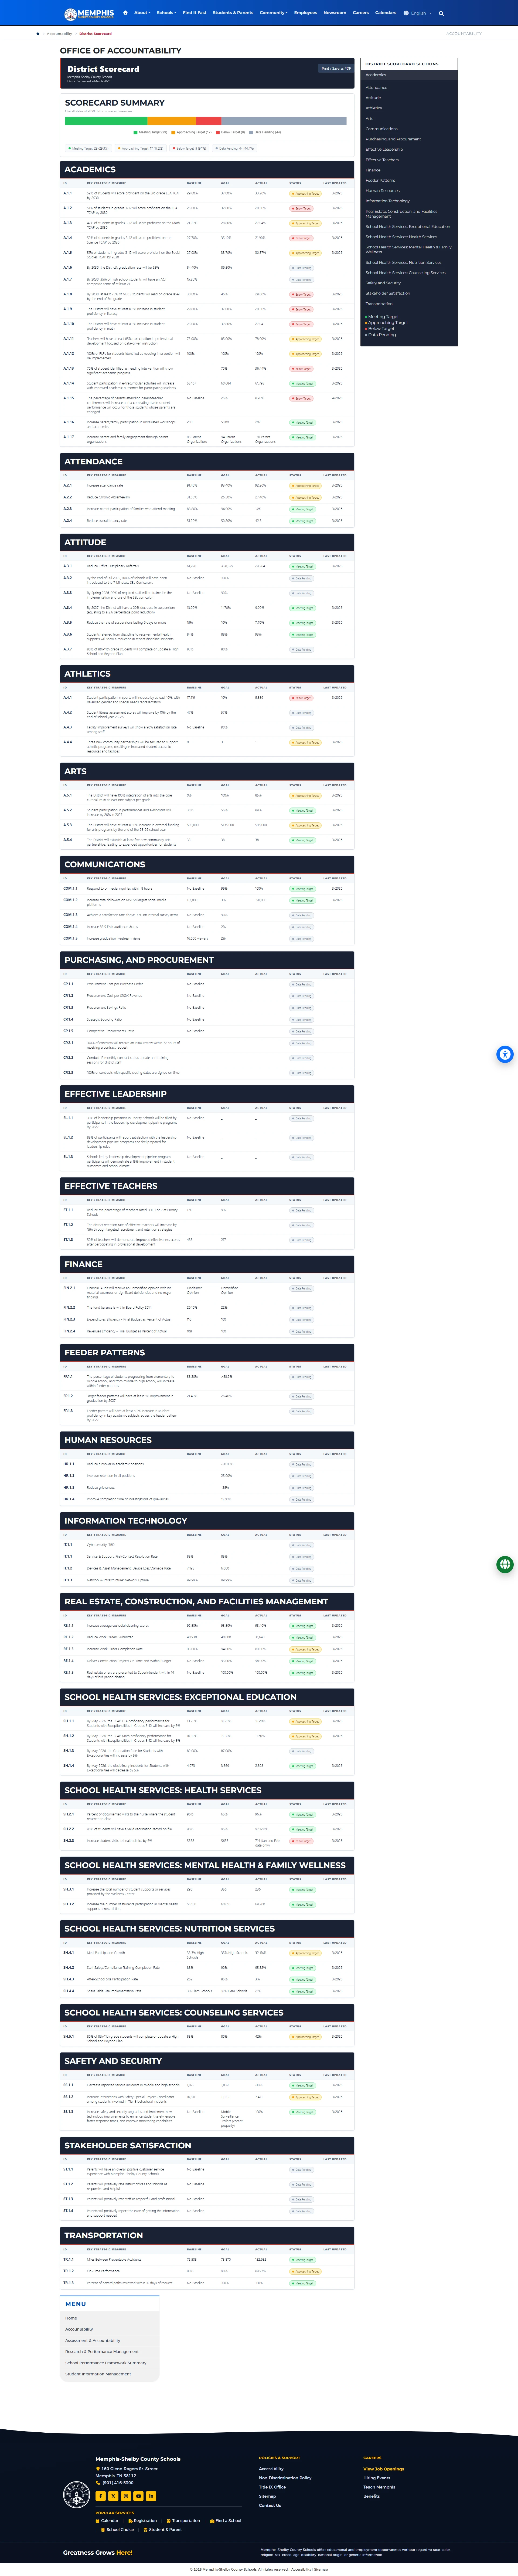
Planning & Scorecard Dashboard
Leadership-facing dashboard experience built to organize district goals, metrics, progress updates, and strategic reporting in a clear, accessible format.
The problem
District leaders needed a clearer way to review progress, organize strategic priorities, and present scorecard information in a format that was easier to scan than static documents or spreadsheets.
What I built
- Designed a dashboard-style interface for goals, metrics, progress indicators, and supporting details.
- Built reusable card and status patterns for leadership-facing reporting.
- Organized complex planning information into clearer sections and visual groupings.
- Created a responsive layout that works across desktop, tablet, and mobile views.
- Focused on readability, accessibility, and quick scanning for executive stakeholders.
Impact
- Improved visibility into district priorities and progress.
- Created a more polished and accessible way to present planning information.
- Reduced reliance on static documents by turning scorecard content into a web-based experience.
- Received positive stakeholder feedback for clarity and presentation.
Training & handoff
Structured the content so updates can be maintained from organized planning data and repeatable layout patterns.